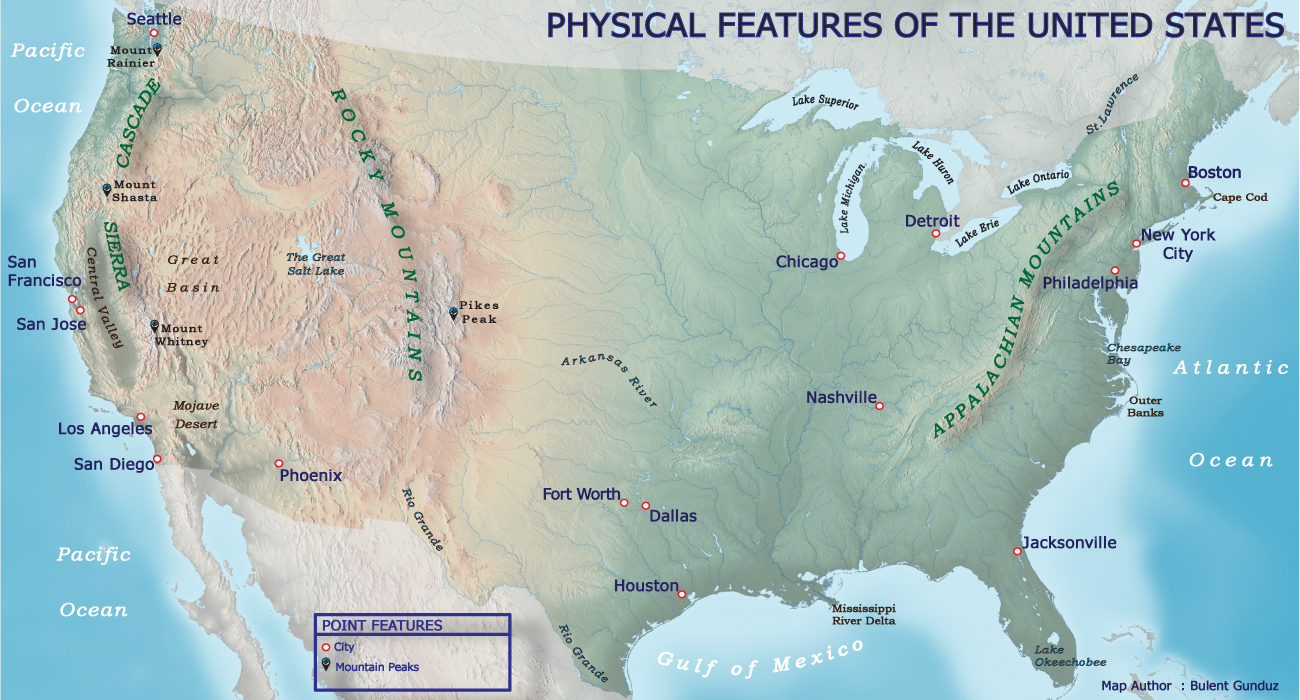
Hello everyone! This was the day we created our first map in the class. Fortyfour (44) labels and twenty (20) point symbols were placed on the US map. It seems, that was an easy study, as looking at the final output, which was clearly not. I can say, this map is not so bad for the first time. What do you think?
As you are looking at the map above, at the first glance, I guess some type elements are too small. I just tried to make all the same features at the same size. The East Coast and the West Coast became a little crowded, so I had to make the types smaller. I have used Adobe Illustrator for creating this map, getting the basemap from provided lesson materials. I am also pretty new on Illustrator. I watched some educational videos on Youtube, and they are definetely useful.
While mapping, I learned lots of new information about the U.S. physical environment. For example, Lake Okeechobee is the capital of the alligator population in Florida, even maybe in the country. Here is an interesting and informative web article about the lake and alligators. You can also visit the website at https://a-z-animals.com/ for additional information about animal facts. I recommend it.
You can download the pfd format file of the map via the link below. I am really excited for the next maps we are going to create in the class. For the next maps, we are going to use the famous ArcGIS software, which is probably more complicated. Thank you for reading.
Bulent
“Here is the link for pdf version.”
Comment (0)